By: WAGISA Community Engagement Committee
The 2023 Dick Thomas Award or ‘DTA’ was back in person for the first time since 2019 this year’s competition exceeded all expectations. The student presentations made for an edge of the seat experience showcasing innovative analysis and real-world application. The event really drew a crowd! In fact, the DTA was the most attended session at the conference! The competition was held on June 14th at the University of Washington during the annual WAGISA Washington GIS Conference.
For those not familiar with he DTA, this award was established to honor a Washington state GIS pioneer and mentor, Richard ‘Dick’ Thomas, who passed away in 2006. The intent of this award is to honor Dick by continuing his work of encouraging students to excel in their studies and to transition successfully into careers in the field of GIS. WAGISA’s objective is to inspire students to present their original work related to GIS, geography, or geographic research at the annual Washington GIS conference. We were lucky to have four fabulous judges:
- Tonya Kauhi – Washington State Department of Health
- Peter Keum – King County Department of Natural Resource and Parks
- Ashlee Llewellyn – Esri
- Bruce Schneider – Washington Department of Natural Resources
We had 10 wonderful student presenters in four groups this year. The student projects were top notch and were chosen in a competitive selection process among many impressive submissions.
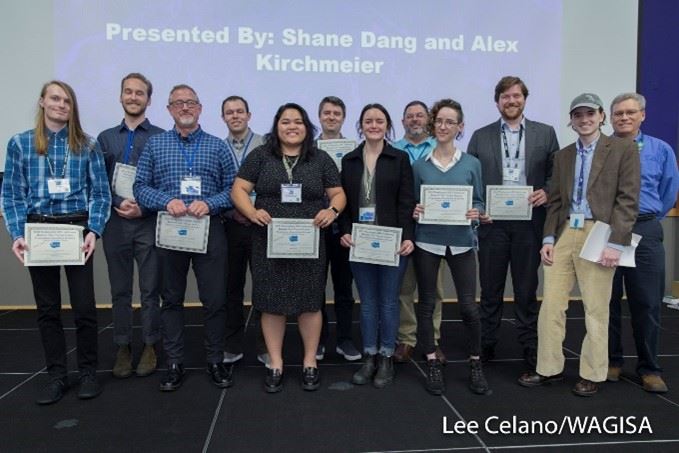
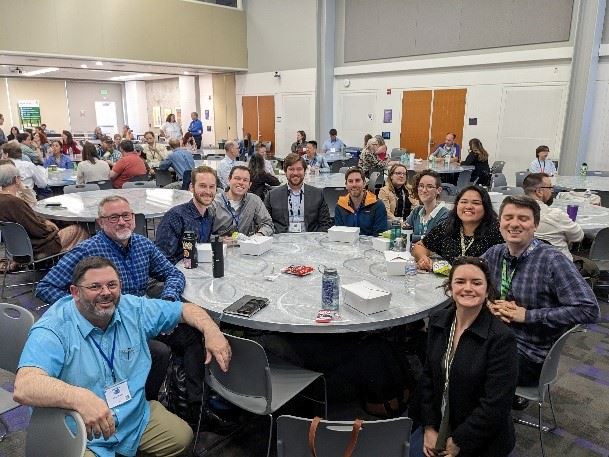
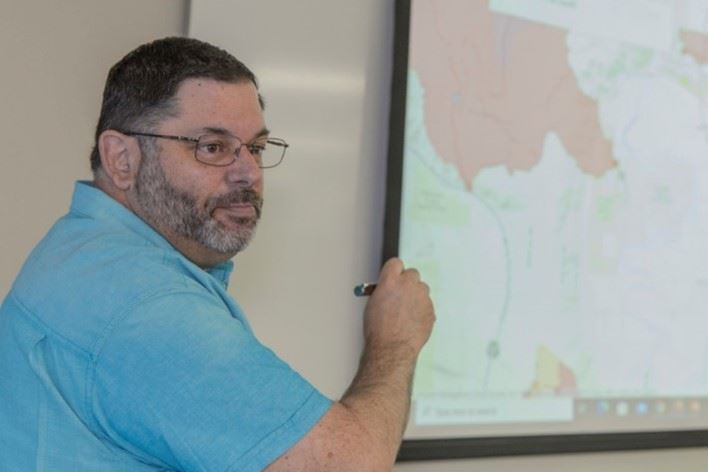
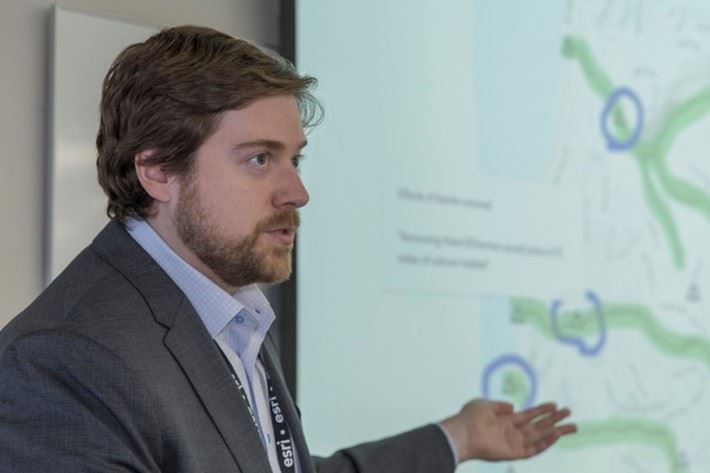
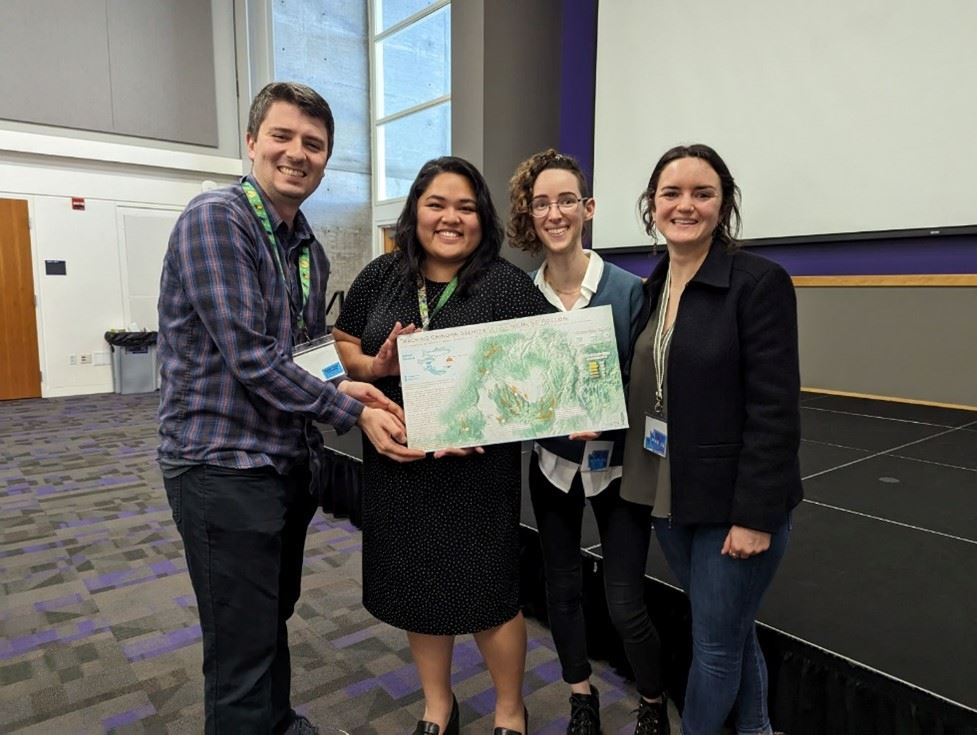
Students on the main stage with their award certificates. Students share a table for some conversation and laughs
This year’s Winners are:
- First Place: Alex Kirchmeier and Shane Dang with a presentation titled An Informal Geovisualization of Tea Shops in Seattle’s International District. Alex and Shane are students at the University of Washington Seattle and will receive a check for $500, free one year membership to WAGISA, free entry to the 2025 WAGISA GIS conference and an opportunity to submit an article to WAGISA’s blog, The Summit Scoop.
- Second Place: Andrew From and Ken Charm with a presentation titled King County Fish Passage Barriers: A Method for Multiple Agencies to Combine Efforts for the Greater Good. Andrew and Ken are student at the University of Washington Seattle and will receive a check for $250, free one year membership to WAGISA and an opportunity to submit an article to The Summit Scoop.
- Third Place: Nicholas Conway, Salomé Frévol, Paige Hosman, Candice Magbag Plendl with their presentation titled Investigating Chinook Spawning Patterns in the Face of Changing Climate and Surveying Challenges in Eastern Oregon. Nicholas, Salomé, Paige and Candice are students at the University of Washington Seattle and will receive a check for $125, free one year membership to WAGISA, and an opportunity to submit an article to the Summit Scoop.
- Honorable Mention: Byron Alvarenga-Beech, Ian Berndt, and Jeff LeDoux with their presentation titled Age Friendly Seattle Discount Directory. Byron, Ian and Jeff are students at the University of Washington Seattle.
Please continue reading to learn about the experiences, insights, and project details from the competitors.
First Place
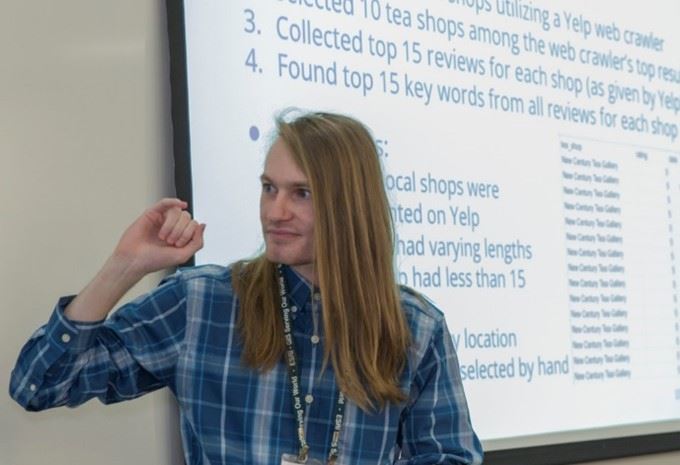
Presenters: Alex Kirchmeier and Shane Dang
Project Title: An Informal Geovisualization of Tea Shops in Seattle’s International District
Abstract:
The Seattle Chinatown-International District is a vibrant hub of Asian culture and heritage, epitomized by the diverse abundance of tea shops scattered throughout. To visualize this unique aspect of Seattle, we created a radial dendrogram overlaid upon a neighborhood-scale map. Our goal was to represent human-spatial experiences characterizing tea shops in the International District using non-cartesian data visualization methods. Our diagram provides keywords associated with various tea shops in the particularly tea-dense International District and the relative frequency of these words in our data, allowing our audience of Seattle residents and visitors to explore the relationships between tea shops and the community. Our map component provides spatial context for the diagram, serving to place our diagram in the real-world space of the International District. Using review data from Yelp, we were able to collect recurring keywords from 15 reviews of each of 10 selected tea shops in the International District. These 10 shops were selected first based on our field observations, with the remaining slots then filled in the order they were given by Yelp and filtered manually to ensure that the selected locations provided tea as a fundamental service. We determined the top 15 keywords for each shop based on the overall frequency of words in the combined 15 reviews for each shop and represented each word’s frequency with a proportional symbol. We completed the diagram by adding a map created in QGIS using the OpenStreetMap layer and the coordinates of the tea shops. This project was inspired by the book Seattleness: A Cultural Atlas, by Tera Hatfield, Jenny Kempson, and Natalie Ross, and completed in the course GEOG 495: Visualizing Seattle offered at the University of Washington, Seattle (Winter 2023).
Reflection
This project came about in quite an impulsive manner; we were prompted to put it together in a class that sought to promote creative approaches to data visualizations, and as two valiant tea enthusiasts, our theme was clear from the start. We were both familiar with tea shops in Seattle’s Chinatown-International District, making it clear that it would be the ideal location for our project. We decided to embrace the creative mission of the course and make our project unique and whimsical while incorporating a theme that brings joy to tea drinkers from all over the area.
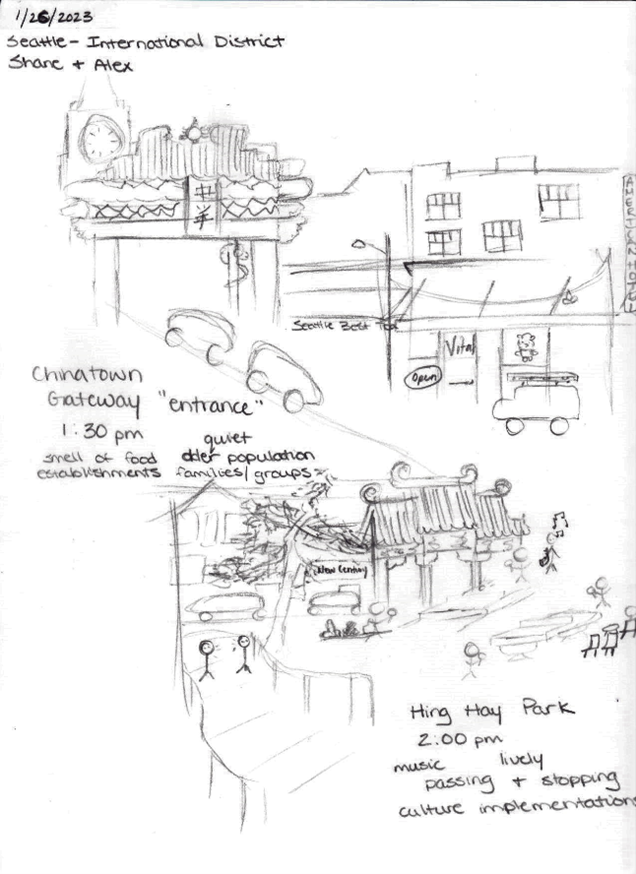
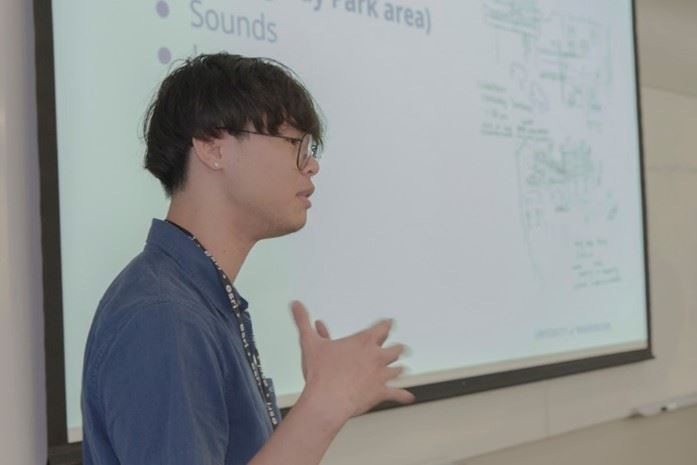
The foundation of our project was built upon field observations in the Chinatown-International District. We had sketched out a few key locations, making notes of our spatial experiences. What could we see? Hear? Smell? What kind of activity was there? Tea was purchased–by us–as we found ourselves staying longer than intended and looking for an excuse for restroom access. The primary takeaway from our excursion was an appreciation for the range of tea shops within the area, prompting us to begin thinking about the rich spatial significance of these shops. This diversity within the tea community, as well as our reflection on the spatial history and culture that tea shops represent, was the inspiration for exploring the unique features of each shop in our project. As we continued to research the Chinatown-International District, we realized that there were rising
Seattle International District sketch
concerns about displacement in the neighborhood; this suddenly added a layer of urgency to our work.
Our project quickly took form from there, and we presented an initial visualization to our classmates. A few months later, we were encouraged by our professor, Gunwha Oh (for whom we are immensely grateful), to submit an abstract to the DTA competition. We were positively flattered that our project had made such an impression in class, and we felt honored to have the opportunity to continue sharing it with others. This opportunity did indeed materialize, as we were fortunate enough to be selected to present at the competition.
And… we won? It was so incredibly validating to see the support that others had for our creative mapping project. To have inspired others to support the local shops in the Chinatown-International District, and to have encouraged the adoption of creative and accessible approaches to mapping and visualizing data, is truly wonderful. Neither of us had previously presented in a professional setting; being able to have this experience is invaluable to our professional confidence. We are grateful for the opportunity to have our work recognized, but even more so for the chance to connect with like-minded individuals who share a passion for harnessing geospatial information for positive change.
This unique opportunity to engage with the Washington GIS community was a remarkable experience as undergraduates and one that we are immensely thankful for. For Alex, this competition directly inspired further academic engagement with creative maps and visualizations as he finishes his final year as an undergraduate in 2023-24. For Shane, this competition was not just a showcase of GIS skills and knowledge to prove the outcome of his college education, but also a journey of self-discovery, resilience, and the power of collaborative effort with a reminder that GIS is more than just a tool; it's a gateway or lens to understanding the world around us and solving real-world problems.
As we move forward from this competition, we carry with us not only a winners’ trophy but a renewed sense of purpose and a deep appreciation for the incredible community that exists within the realm of GIS. This competition was an unforgettable milestone in our academic journey, and we are excited to see how the skills and connections forged here will continue to shape our path and contribute to the meaningful use of geographic information systems in the years to come.
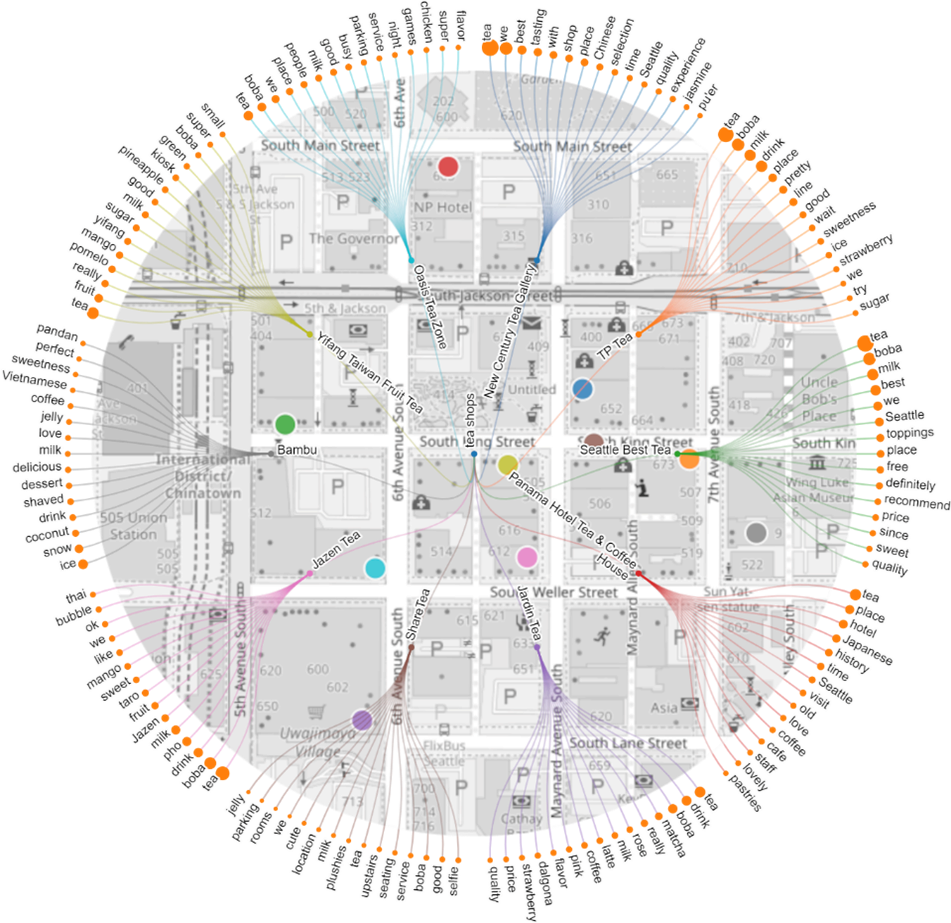
Final project visual
Second Place
Presenters: Andrew From and Ken Charm
Project Title: King County Fish Passage Barriers: A Method for Multiple Agencies to Combine Efforts for the Greater Good
Abstract:
The King County Fish Passage Restoration Program (FPRP) was launched to address the issue of fish passage barriers to satisfy a key component of King County’s Clean Water Healthy Habitat initiative. Three salmonid species are listed as threatened and federally protected under the Endangered Species (Oncorhynchus mykiss), Puget Sound Chinook salmon (O. tshawytscha), and bull trout (Salvelinus confluentus). These species have declined far below historic population levels thus limiting the preferred food for the Puget Sound Southern Resident killer whale (Orcinus orca). As a result, O. orca was listed as endangered under the ESA in 2005.
By removing key barriers to historic upstream habitat for salmon spawning and rearing, the FPRP offers an excellent return on investment for restoring salmon abundance. By 2032, FPRP’s goal is to remove enough fish passage barriers to increase accessible salmon habitat by at least 50% relative to 2022.
The Washington State Department of Transportation (WSDOT), the other major owner of fish passage barriers in King County, is working towards correcting 90% of the barriers they manage by 2030.relative to 2013.
The final GIS will show subwatersheds defined and color coded by each individual barrier. Using the plans published by FPRP and WSDOT, the GIS will visualize the increase in accessible watersheds over time resulting from barrier removal plans. Further, the GIS will show areas where collaboration with other entities could significantly increase the amount of accessible fish habitat than would be created with just the FPRP and/or WSDOT proposed projects. In the end, this GIS will create a visual demonstration of areas within King County where collaboration between FPRP, WSDOT, and other entities could combine to make significant improvements to salmonid access within King County.
Third Place
Presenters: Nicholas Conway, Salomé Frévol, Paige Hosman, Candice Plendl
Project Title: Investigating Chinook Spawning Patterns in the Face of Changing Climate and Surveying Challenges in Eastern Oregon
Each year, spring Chinook salmon (Oncorhynchus tshawytscha) return to the Grande Ronde watershed in eastern Oregon to spawn; however, the population is declining, and the species is currently listed on the federal Endangered Species list. In response to the decline, there have been massive efforts to stabilize and increase the populations of Chinook salmon through different means. Over the past 18 years, the Oregon Department of Fish and Wildlife (ODFW) has amassed an impressive geospatial dataset of redd locations in the watersheds and more recently, ODFW has begun collecting data on carcass locations and their origins (hatchery vs wild). During this time, private land ownership, budget cuts, and forest fires have limited ODFW’s ability to consistently survey each previously sampled site, so it is imperative to present the data visually in order to understand whether lack of data in a stream for any given year is due to an absence of salmon activity or an inability to survey, and to identify preliminary trends in Chinook salmon habitat use based on environmental variables.
Our team developed a web application that would allow ODFW and their co-managers to visualize, by year, their surveying efforts and the characteristics and spatial extent of redds and carcasses within a stream network, with additional maps on generational data. To ensure project longevity, we streamlined data importing directly from Excel, automated processing, and created easy-to-follow documentation so that ODFW will be able to continue using the tool for years to come.
Through this process, our team not only accomplished skills in GIS like cartographic design, using Model and Experience Builder, and knowing the importance of being cozy and familiar with your data; we also forged a strong team relationship, highlighted each other’s strengths, recognized how to support any shortcomings, and turned lessons learned into transferable skills in any circumstance.
Honorable Mention
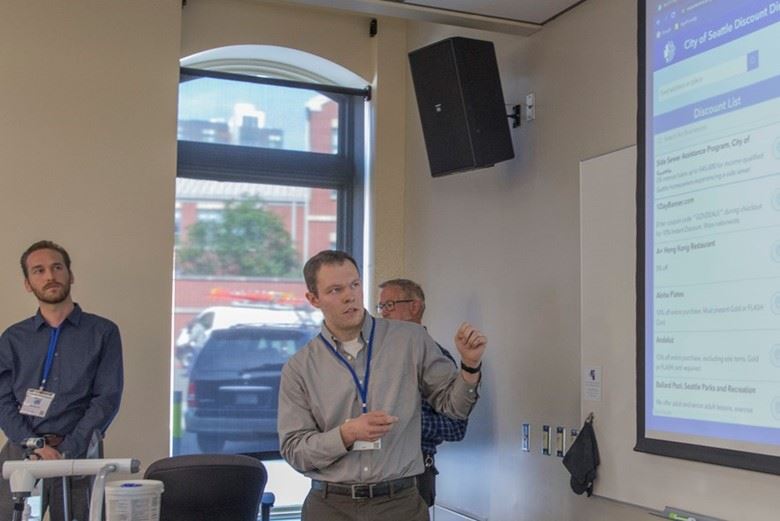
Presenters: Byron Alvarenga-Beech, Ian Berndt, and Jeff LeDoux
Project Title: Age Friendly Seattle Discount Directory
Abstract:
The Human Services Department within the City of Seattle is looking to reimagine its current Age Discount Directory, a database that collects special discounts for those aged 65 and older and/or adults living with disabilities. Our project aims to build a better, more age-friendly Seattle community through strengthening customer relations and expanding access to goods and services to underserved groups or those who may need extra assistance.
The current tools that support the directory are limited and do not encourage a user-friendly experience. In order to make the directory more useful for both businesses and our community of older adults and people living with disabilities, we have built the following:
- A Discount Directory Map that arranges the businesses into five different categories with matching color distinctions to maintain cartographic integrity and increase map usability. Users are able to view categories one-by-one using a filter widget and will also be able to find directions to businesses from their current location.
- An upgraded Directory List for those that do not wish to use the interactive map and for Seattle businesses that have online exclusive discounts. Similar to our map, this list has filterable categories to help narrow down searches. Additionally, we have included options that can display a chosen business over on the Directory Map or to Google Maps with the destination already filled out. In order to align with our goals of accessibility, this list can be downloaded as a printable pdf document.
- Finally, we have included an updated Directory Business Submission Form for businesses wanting to join the Age Discount Directory. Using Survey 123, this form geolocates the submitted businesses and will automatically categorize, color, and implement the businesses onto the Directory Map after its location is approved by an administrator.